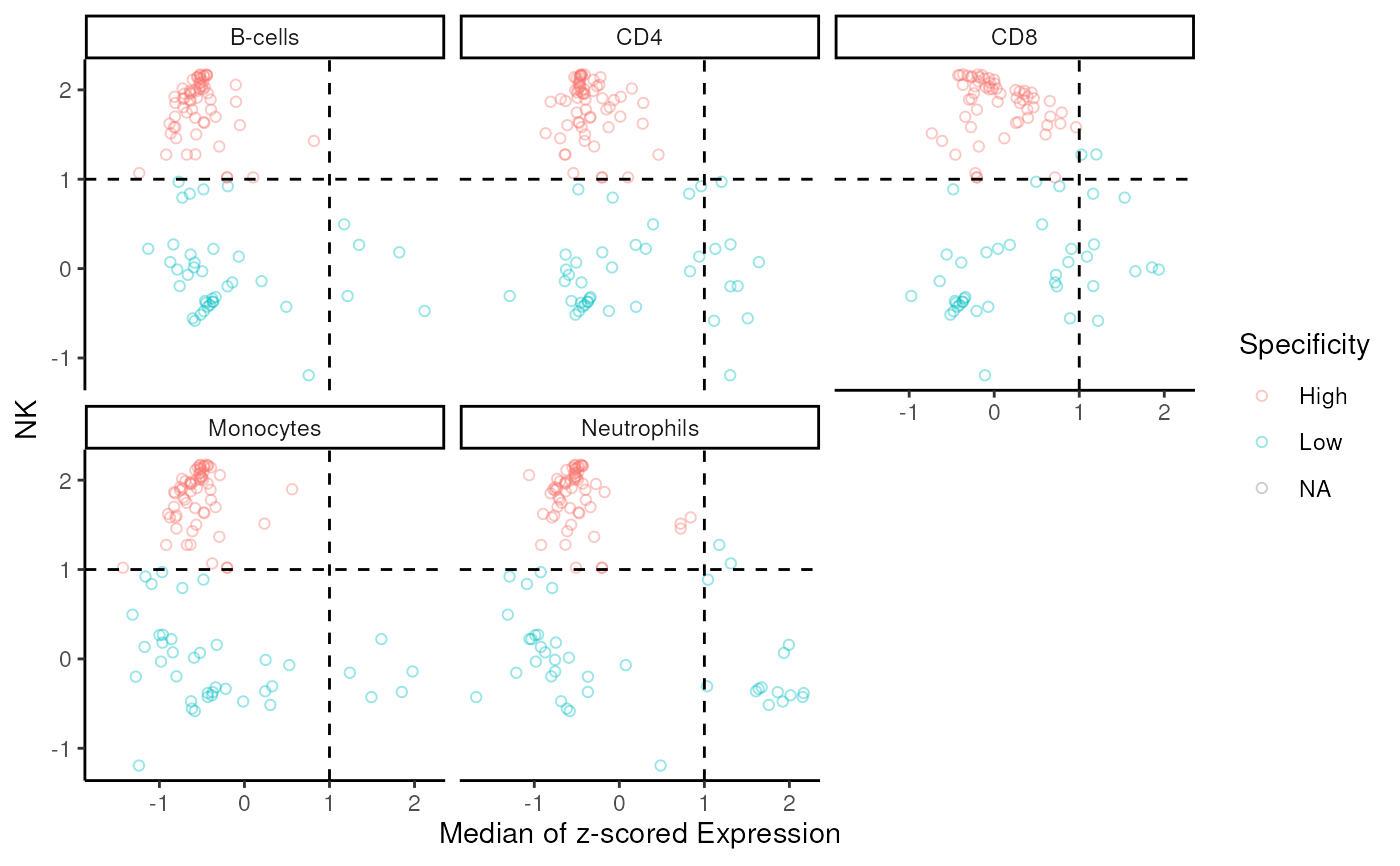
Scatter plot of signature for specific subset vs others
Source:R/AllGenerics.R, R/sig_scatter_plot-methods.R
sig_scatter_plot.RdScatter plot depicts mean expression for each signature gene in the specific subset against other cell types.
sig_scatter_plot(
  data,
  sigs,
  group_col,
  target_group,
  slot = "counts",
  xint = 1,
  yint = 1,
  gene_id = "SYMBOL"
)

# S4 method for matrix,vector,vector,character
sig_scatter_plot(
  data,
  sigs,
  group_col,
  target_group,
  xint = 1,
  yint = 1,
  gene_id = "SYMBOL"
)

# S4 method for Matrix,vector,vector,character
sig_scatter_plot(
  data,
  sigs,
  group_col,
  target_group,
  xint = 1,
  yint = 1,
  gene_id = "SYMBOL"
)

# S4 method for DGEList,vector,character,character
sig_scatter_plot(
  data,
  sigs,
  group_col,
  target_group,
  slot = "counts",
  xint = 1,
  yint = 1,
  gene_id = "SYMBOL"
)

# S4 method for ExpressionSet,vector,character,character
sig_scatter_plot(
  data,
  sigs,
  group_col,
  target_group,
  xint = 1,
  yint = 1,
  gene_id = "SYMBOL"
)

# S4 method for Seurat,vector,character,character
sig_scatter_plot(
  data,
  sigs,
  group_col,
  target_group,
  slot = "counts",
  xint = 1,
  yint = 1,
  gene_id = "SYMBOL"
)

# S4 method for SummarizedExperiment,vector,character,character
sig_scatter_plot(
  data,
  sigs,
  group_col,
  target_group,
  slot = "counts",
  xint = 1,
  yint = 1,
  gene_id = "SYMBOL"
)

# S4 method for list,vector,character,character
sig_scatter_plot(
  data,
  sigs,
  group_col,
  target_group,
  slot = "counts",
  xint = 1,
  yint = 1,
  gene_id = "SYMBOL"
)
Arguments
- data
expression data, can be matrix, DGEList, eSet, seurat, sce...
- sigs
a vector of signature (Symbols)
- group_col
character or vector, specify the column name to compare in coldata
- target_group
pattern, specify the group of interest as reference
- slot
character, indicate which slot used as expression, optional
- xint
intercept of vertical dashed line, default 1
- yint
intercept of horizontal dashed line, default 1
- gene_id
character, indicate the ID type of rowname of expression data's , could be one of 'ENSEMBL', 'SYMBOL', ... default 'SYMBOL'
Value
patchwork or ggplot of scatter plot of median expression
Examples
data("im_data_6", "nk_markers")
sig_scatter_plot(
  sigs = nk_markers$HGNC_Symbol, data = im_data_6,
  group_col = "celltype:ch1", target_group = "NK",
  gene_id = "ENSEMBL"
)
#> 'select()' returned 1:many mapping between keys and columns
#> Warning: Removed 10 rows containing missing values or values outside the scale range
#> (`geom_point()`).