Heatmap original markers and screened signature
Source:R/AllGenerics.R, R/sig_heatmap-methods.R
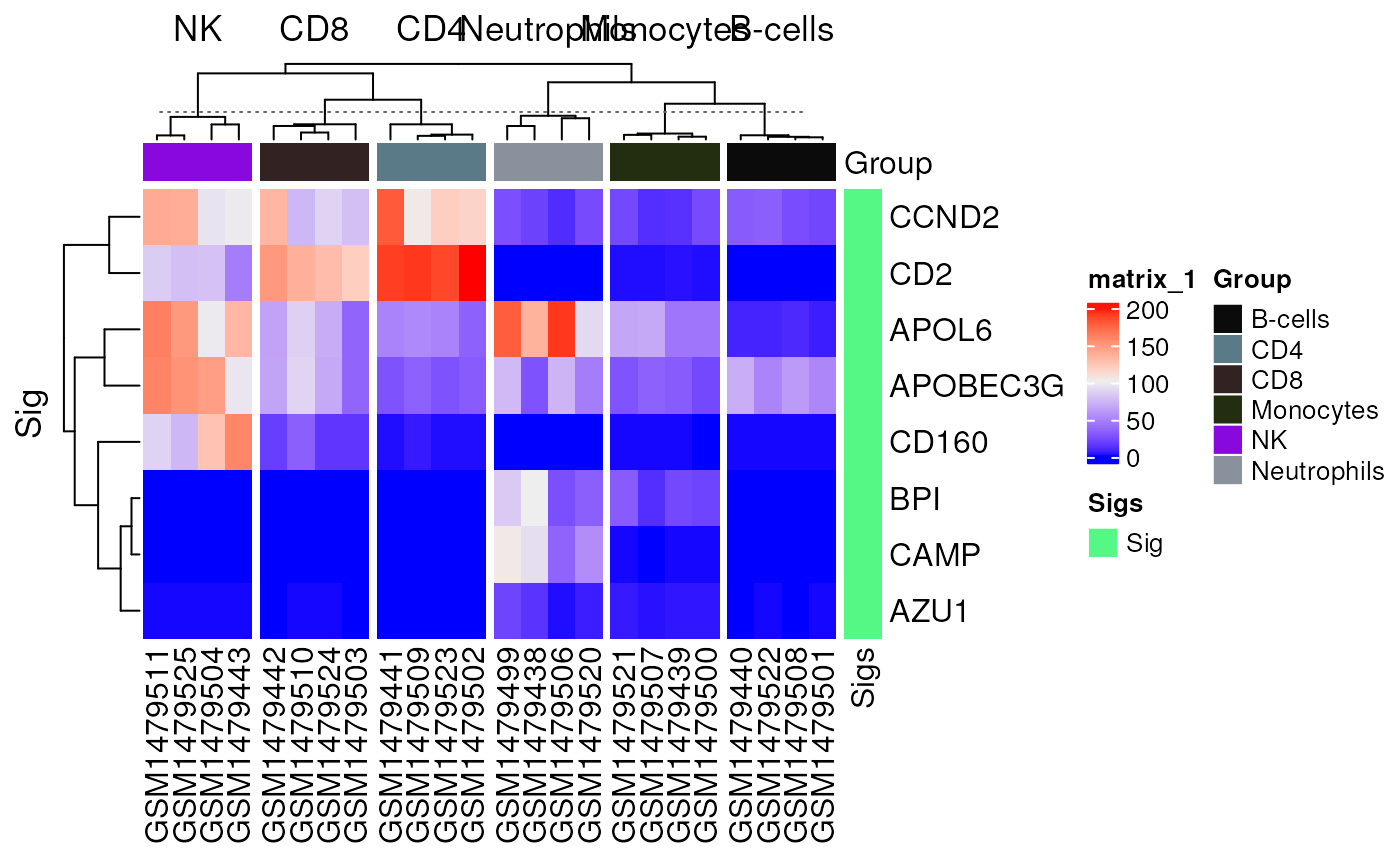
sig_heatmap.RdCompare the heatmap before and after screening.
sig_heatmap(
  data,
  sigs,
  group_col,
  markers,
  scale = c("none", "row", "column"),
  gene_id = "SYMBOL",
  ranks_plot = FALSE,
  slot = "counts",
  ...
)

# S4 method for matrix,character,vector,missing
sig_heatmap(
  data,
  sigs,
  group_col,
  markers,
  scale = c("none", "row", "column"),
  gene_id = "SYMBOL",
  ranks_plot = FALSE,
  slot = "counts",
  ...
)

# S4 method for matrix,character,vector,vector
sig_heatmap(
  data,
  sigs,
  group_col,
  markers,
  scale = c("none", "row", "column"),
  gene_id = "SYMBOL",
  ranks_plot = FALSE,
  slot = "counts",
  ...
)

# S4 method for matrix,list,vector,missing
sig_heatmap(
  data,
  sigs,
  group_col,
  markers,
  scale = c("none", "row", "column"),
  gene_id = "SYMBOL",
  ranks_plot = FALSE,
  slot = "counts",
  ...
)

# S4 method for Matrix,ANY,vector,ANY
sig_heatmap(
  data,
  sigs,
  group_col,
  markers,
  scale = c("none", "row", "column"),
  gene_id = "SYMBOL",
  ranks_plot = FALSE,
  slot = "counts",
  ...
)

# S4 method for data.frame,ANY,vector,ANY
sig_heatmap(
  data,
  sigs,
  group_col,
  markers,
  scale = c("none", "row", "column"),
  gene_id = "SYMBOL",
  ranks_plot = FALSE,
  slot = "counts",
  ...
)

# S4 method for DGEList,ANY,character,ANY
sig_heatmap(
  data,
  sigs,
  group_col,
  markers,
  scale = "none",
  gene_id = "SYMBOL",
  ranks_plot = FALSE,
  slot = "counts",
  ...
)

# S4 method for ExpressionSet,ANY,character,ANY
sig_heatmap(
  data,
  sigs,
  group_col,
  markers,
  scale = c("none", "row", "column"),
  gene_id = "SYMBOL",
  ranks_plot = FALSE,
  slot = "counts",
  ...
)

# S4 method for Seurat,ANY,character,ANY
sig_heatmap(
  data,
  sigs,
  group_col,
  markers,
  scale = "none",
  gene_id = "SYMBOL",
  ranks_plot = FALSE,
  slot = "counts",
  ...
)

# S4 method for SummarizedExperiment,ANY,character,ANY
sig_heatmap(
  data,
  sigs,
  group_col,
  markers,
  scale = "none",
  gene_id = "SYMBOL",
  ranks_plot = FALSE,
  slot = "counts",
  ...
)

# S4 method for list,ANY,character,ANY
sig_heatmap(
  data,
  sigs,
  group_col,
  markers,
  scale = "none",
  gene_id = "SYMBOL",
  ranks_plot = FALSE,
  slot = "counts",
  ...
)
Arguments
- data
expression data, can be matrix, DGEList, eSet, seurat, sce...
- sigs
a vector of signature (Symbols) or a list of signatures
- group_col
character or vector, specify the column name to compare in coldata
- markers
a vector of gene names, listed the gene symbols of original markers pool
- scale
could be one of 'none' (default), 'row' or 'column'
- gene_id
character, indicate the ID type of rowname of expression data's , could be one of 'ENSEMBL', 'SYMBOL', ... default 'SYMBOL'
- ranks_plot
logical, if to use ranks instead of expression of genes to draw heatmap
- slot
character, indicate which slot used as expression, optional
- ...
params for
ComplexHeatmap::Heatmap()
Value
patchwork object of heatmap
Examples
data("im_data_6", "nk_markers")
sig_heatmap(
  data = im_data_6, sigs = nk_markers$HGNC_Symbol[1:10],
  group_col = "celltype:ch1",
  gene_id = "ENSEMBL"
)
#> 'select()' returned 1:many mapping between keys and columns
#> Gene CCL4 is not in data.
#> Gene CCL5 is not in data.