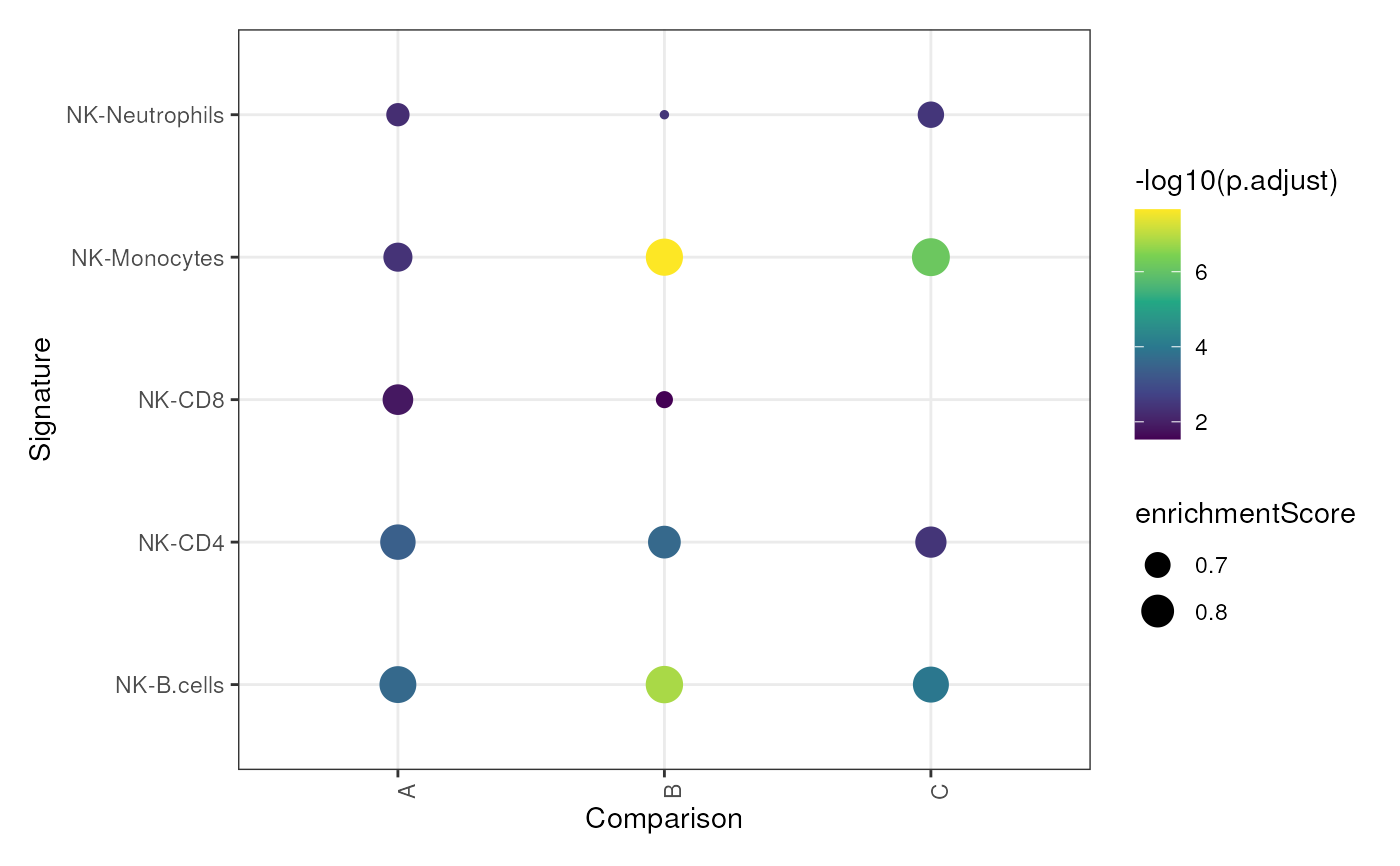
Visualize GSEA result with input list of gene symbols.
Source:R/AllGenerics.R, R/sig_gseaplot-methods.R
sig_gseaplot.RdVisualize GSEA result with multiple lists of genes by using clusterProfiler.
sig_gseaplot(
  data,
  sigs,
  group_col,
  target_group,
  gene_id = "SYMBOL",
  slot = "counts",
  method = c("dotplot", "gseaplot"),
  col = "-log10(p.adjust)",
  size = "enrichmentScore",
  pvalue_table = FALSE,
  digits = 2,
  rank_stat = "logFC",
  ...
)

# S4 method for MArrayLM,vector
sig_gseaplot(
  data,
  sigs,
  group_col,
  target_group,
  gene_id = "SYMBOL",
  slot = "counts",
  method = c("dotplot", "gseaplot"),
  col = "-log10(p.adjust)",
  size = "enrichmentScore",
  pvalue_table = FALSE,
  digits = 2,
  rank_stat = "logFC",
  ...
)

# S4 method for MArrayLM,list
sig_gseaplot(
  data,
  sigs,
  group_col,
  target_group,
  gene_id = "SYMBOL",
  slot = "counts",
  method = c("dotplot", "gseaplot"),
  col = "-log10(p.adjust)",
  size = "enrichmentScore",
  pvalue_table = FALSE,
  digits = 2,
  rank_stat = "logFC",
  ...
)

# S4 method for DGEList,ANY
sig_gseaplot(
  data,
  sigs,
  group_col,
  target_group,
  gene_id = "SYMBOL",
  slot = "counts",
  method = c("dotplot", "gseaplot"),
  col = "-log10(p.adjust)",
  size = "enrichmentScore",
  pvalue_table = FALSE,
  digits = 2,
  rank_stat = "logFC",
  ...
)

# S4 method for ANY,ANY
sig_gseaplot(
  data,
  sigs,
  group_col,
  target_group,
  gene_id = "SYMBOL",
  slot = "counts",
  method = c("dotplot", "gseaplot"),
  col = "-log10(p.adjust)",
  size = "enrichmentScore",
  pvalue_table = FALSE,
  digits = 2,
  rank_stat = "logFC",
  ...
)

# S4 method for list,ANY
sig_gseaplot(
  data,
  sigs,
  group_col,
  target_group,
  gene_id = "SYMBOL",
  slot = "counts",
  method = c("dotplot", "gseaplot"),
  col = "-log10(p.adjust)",
  size = "enrichmentScore",
  pvalue_table = FALSE,
  digits = 2,
  rank_stat = "logFC",
  ...
)
Arguments
- data
expression data, can be matrix, DGEList, eSet, seurat, sce...
- sigs
a vector of signature (Symbols) or a list of signatures
- group_col
character or vector, specify the column name to compare in coldata
- target_group
pattern, specify the group of interest as reference
- gene_id
character, indicate the ID type of rowname of expression data's , could be one of 'ENSEMBL', 'SYMBOL', ... default 'SYMBOL'
- slot
character, indicate which slot used as expression, optional
- method
one of "gseaplot" and "dotplot", how to plot GSEA result
- col
column name of
clusterProfiler::GSEA()result, used for dot col when method = "dotplot"- size
column name of
clusterProfiler::GSEA()result, used for dot size when method = "dotplot"- pvalue_table
logical, if to add p value table if method = "gseaplot"
- digits
num, specify the number of significant digits of pvalue table
- rank_stat
character, specify which metric used to rank for GSEA, default "logFC"
- ...
params for function
get_de_table()and functionenrichplot::gseaplot2()
Value
patchwork object for all comparisons
Examples
data("im_data_6", "nk_markers")
sig_gseaplot(
  sigs = list(
    A = nk_markers$HGNC_Symbol[1:15],
    B = nk_markers$HGNC_Symbol[20:40],
    C = nk_markers$HGNC_Symbol[60:75]
  ),
  data = im_data_6, group_col = "celltype:ch1",
  target_group = "NK", gene_id = "ENSEMBL"
)
#> 'select()' returned 1:many mapping between keys and columns
#>        NK-Neutrophils NK-Monocytes NK-B.cells NK-CD4 NK-CD8
#> Down             4009         3946       3143   2698   2153
#> NotSig           1486         2683       4418   4991   6191
#> Up               4926         3792       2860   2732   2077
#> 'select()' returned 1:many mapping between keys and columns
#>
#> preparing geneSet collections...
#> GSEA analysis...
#> Warning: There are ties in the preranked stats (0.88% of the list).
#> The order of those tied genes will be arbitrary, which may produce unexpected results.
#> leading edge analysis...
#> done...
#> preparing geneSet collections...
#> GSEA analysis...
#> Warning: There are ties in the preranked stats (1.05% of the list).
#> The order of those tied genes will be arbitrary, which may produce unexpected results.
#> leading edge analysis...
#> done...
#> preparing geneSet collections...
#> GSEA analysis...
#> Warning: There are ties in the preranked stats (1.35% of the list).
#> The order of those tied genes will be arbitrary, which may produce unexpected results.
#> leading edge analysis...
#> done...
#> preparing geneSet collections...
#> GSEA analysis...
#> Warning: There are ties in the preranked stats (2.2% of the list).
#> The order of those tied genes will be arbitrary, which may produce unexpected results.
#> leading edge analysis...
#> done...
#> preparing geneSet collections...
#> GSEA analysis...
#> Warning: There are ties in the preranked stats (2.31% of the list).
#> The order of those tied genes will be arbitrary, which may produce unexpected results.
#> leading edge analysis...
#> done...