Make a matrix plot of PCA with top PCs
Source:R/AllGenerics.R, R/pca_matrix_plot-methods.R
pca_matrix_plot.RdMake a matrix plot of PCA with top PCs
pca_matrix_plot(
  data,
  features = "all",
  slot = "counts",
  group_by = NULL,
  scale = TRUE,
  n = 4,
  loading = FALSE,
  n_loadings = 10,
  gene_id = "SYMBOL"
)

# S4 method for matrix
pca_matrix_plot(
  data,
  features = "all",
  group_by = NULL,
  scale = TRUE,
  n = 4,
  loading = FALSE,
  n_loadings = 10,
  gene_id = "SYMBOL"
)

# S4 method for Matrix
pca_matrix_plot(
  data,
  features = "all",
  group_by = NULL,
  scale = TRUE,
  n = 4,
  loading = FALSE,
  n_loadings = 10,
  gene_id = "SYMBOL"
)

# S4 method for data.frame
pca_matrix_plot(
  data,
  features = "all",
  group_by = NULL,
  scale = TRUE,
  n = 4,
  loading = FALSE,
  n_loadings = 10,
  gene_id = "SYMBOL"
)

# S4 method for ExpressionSet
pca_matrix_plot(
  data,
  features = "all",
  group_by = NULL,
  scale = TRUE,
  n = 4,
  loading = FALSE,
  n_loadings = 10,
  gene_id = "SYMBOL"
)

# S4 method for DGEList
pca_matrix_plot(
  data,
  features = "all",
  slot = "counts",
  group_by = NULL,
  scale = TRUE,
  n = 4,
  loading = FALSE,
  n_loadings = 10,
  gene_id = "SYMBOL"
)

# S4 method for SummarizedExperiment
pca_matrix_plot(
  data,
  features = "all",
  slot = "counts",
  group_by = NULL,
  scale = TRUE,
  n = 4,
  loading = FALSE,
  n_loadings = 10,
  gene_id = "SYMBOL"
)

# S4 method for Seurat
pca_matrix_plot(
  data,
  features = "all",
  slot = "counts",
  group_by = NULL,
  scale = TRUE,
  n = 4,
  loading = FALSE,
  n_loadings = 10,
  gene_id = "SYMBOL"
)
Arguments
- data
expression data, can be matrix, eSet, seurat...
- features
vector of gene symbols or 'all', specify the genes used for PCA, default 'all'
- slot
character, specify the slot name of expression to be used, optional
- group_by
character, specify the column to be grouped and colored, default NULL
- scale
logical, if to scale data for PCA, default TRUE
- n
num, specify top n PCs to plot
- loading
logical, if to plot and label loadings of PCA, default 'FALSE'
- n_loadings
num, top n loadings to plot; or a vector of gene IDs; only work when
loading = TRUE- gene_id
character, specify which column of IDs used to calculate TPM, also indicate the ID type of expression data's rowname, could be one of 'ENSEMBL', 'SYMBOL', 'ENTREZ'..., default 'SYMBOL'
Value
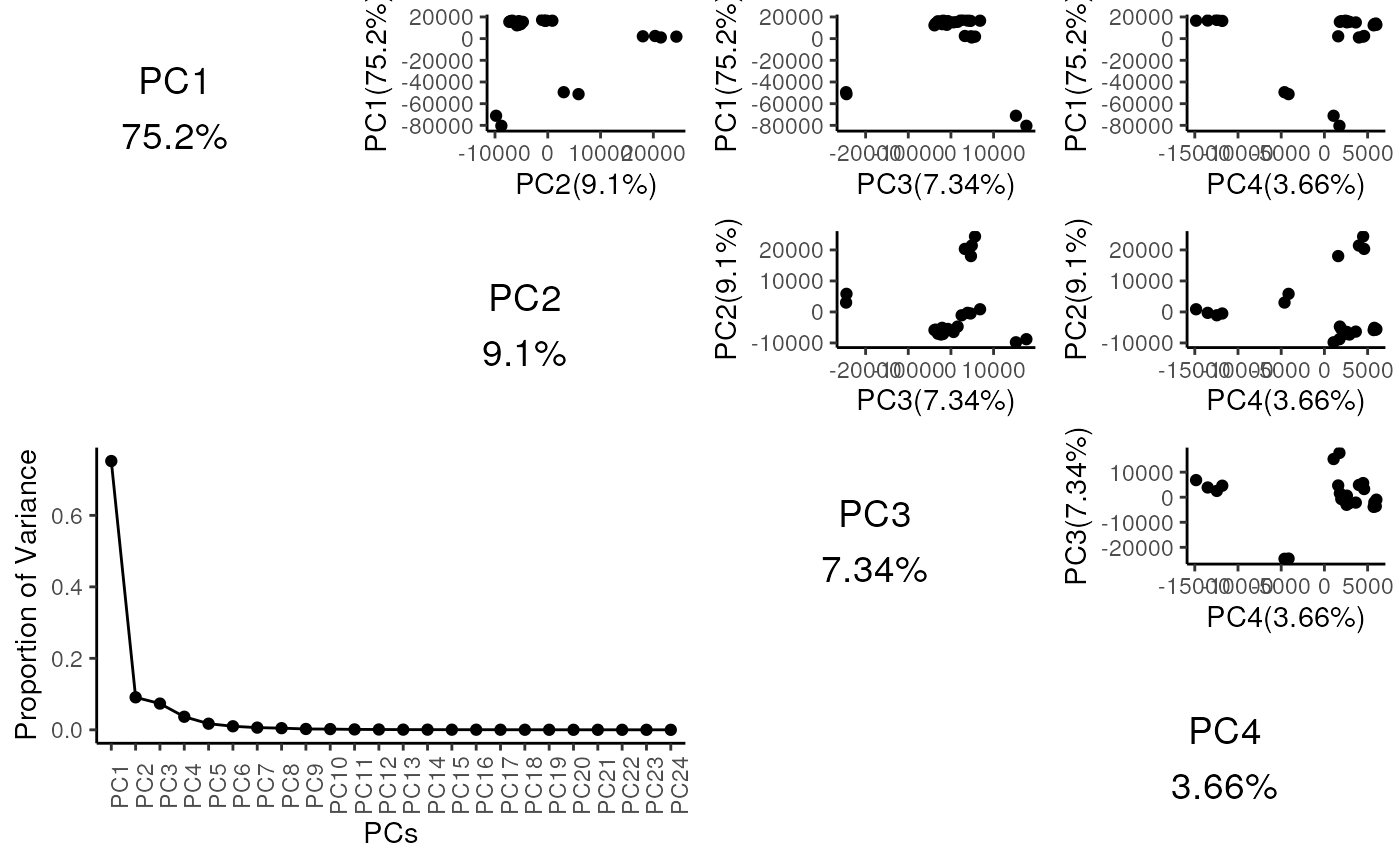
matrix plot of PCA
Examples
data("im_data_6")
pca_matrix_plot(data = im_data_6, scale = FALSE)