Plot cells based on cell position on tissue.
Usage
plotTissue(
  spe,
  targetcell = FALSE,
  k_near = 100,
  targetsize = 3,
  features = NULL,
  assay = "logcounts",
  targetshape = 1,
  targetcolor = "red",
  scaleFactor = 1,
  reverseY = TRUE,
  ...
)
Arguments
- spe
SpatialExperiment object.
- targetcell
Optional. Can input ONE specific cell id to zoom-in on the region of a specific cell.
- k_near
Optional. If targetcell is specified, the k_near cells around the targetcell will be plotted.
- targetsize
Dot size of the targetcell.
- features
Vector of characters. Default is NULL. Useful for plotting expression.
- assay
Character or Integer. To specificy which assay to be used for plotting expression.
- targetshape
Shape of the targetcell.
- targetcolor
Colour of the targetcell.
- scaleFactor
Scale factor to align with the image.
- reverseY
Reverse y coordinates.
- ...
aesthetic mappings to pass to
ggplot2::aes_string().
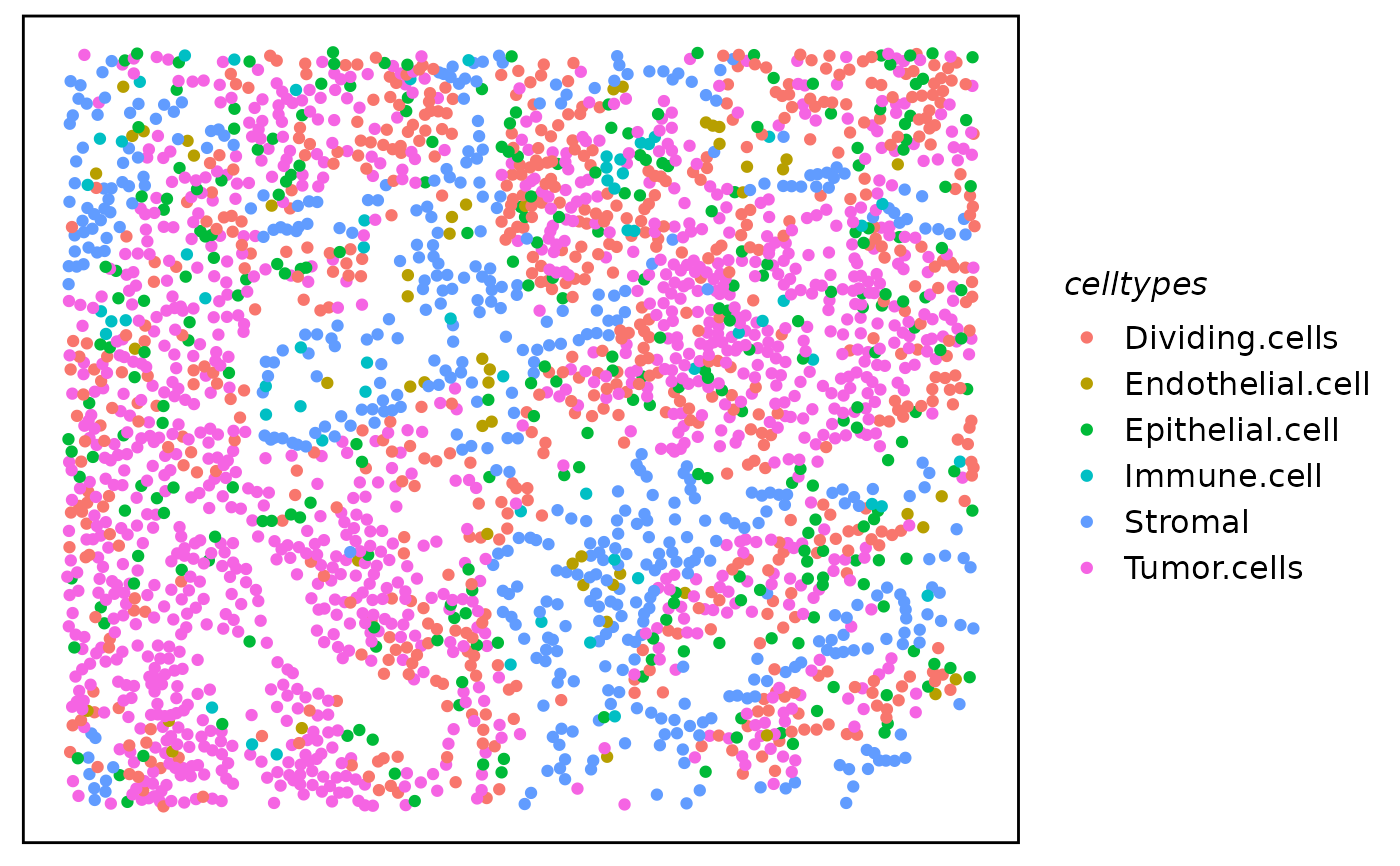
Examples
data("spe_test")

plotTissue(spe, color = celltypes)