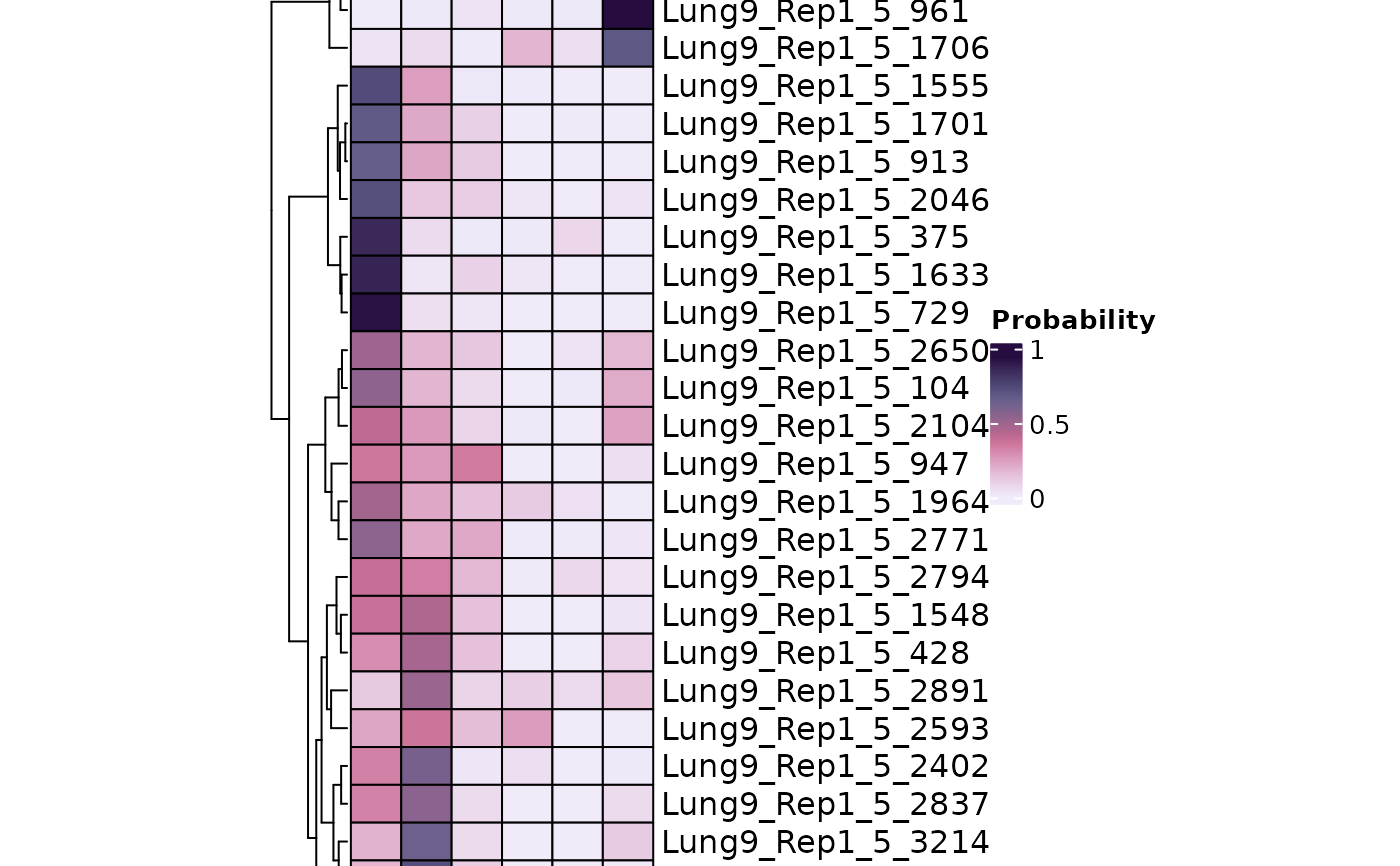
Plot probability matrix as a heatmap
Usage
plotHoodMat(object, ...)

# S4 method for class 'matrix'
plotHoodMat(
  object,
  targetCells = NA,
  n = 30,
  hm_width = 4,
  hm_height = 15,
  clusterRows = TRUE,
  clusterCols = TRUE,
  title = "Probability of neighborhoods"
)

# S4 method for class 'SpatialExperiment'
plotHoodMat(
  object,
  pm_cols,
  targetCells = NA,
  n = 30,
  hm_width = 4,
  hm_height = 15,
  clusterRows = TRUE,
  clusterCols = TRUE,
  title = "Probability of neighborhoods"
)
Arguments
- object
A probability matrix or SpatialExperiment.
- ...
Ignore parameter.
- targetCells
Character. Optional. Can speicify one or more cells to be plotted.
- n
Integer. The number of randomly selected cells to be plotted. This parameter will be used when targetCells is not specify.
- hm_width
Integer. The width of heatmap.
- hm_height
Integer. The height of heatmap.
- clusterRows
Logical. Cluster rows or not.
- clusterCols
Logical. Cluster columns or not.
- title
Title of the heatmap.
- pm_cols
The colnames of probability matrix. This is requires for SpatialExperiment input. Assuming that the probability is stored in the colData.
Examples
data("spe_test")

spe <- readHoodData(spe, anno_col = "celltypes")

fnc <- findNearCells(spe, k = 100)

pm <- scanHoods(fnc$distance)
#> Tau is set to: 22747.4

pm2 <- mergeByGroup(pm, fnc$cells)

spe <- mergeHoodSpe(spe, pm2)

plotHoodMat(spe, pm_cols = colnames(pm2))