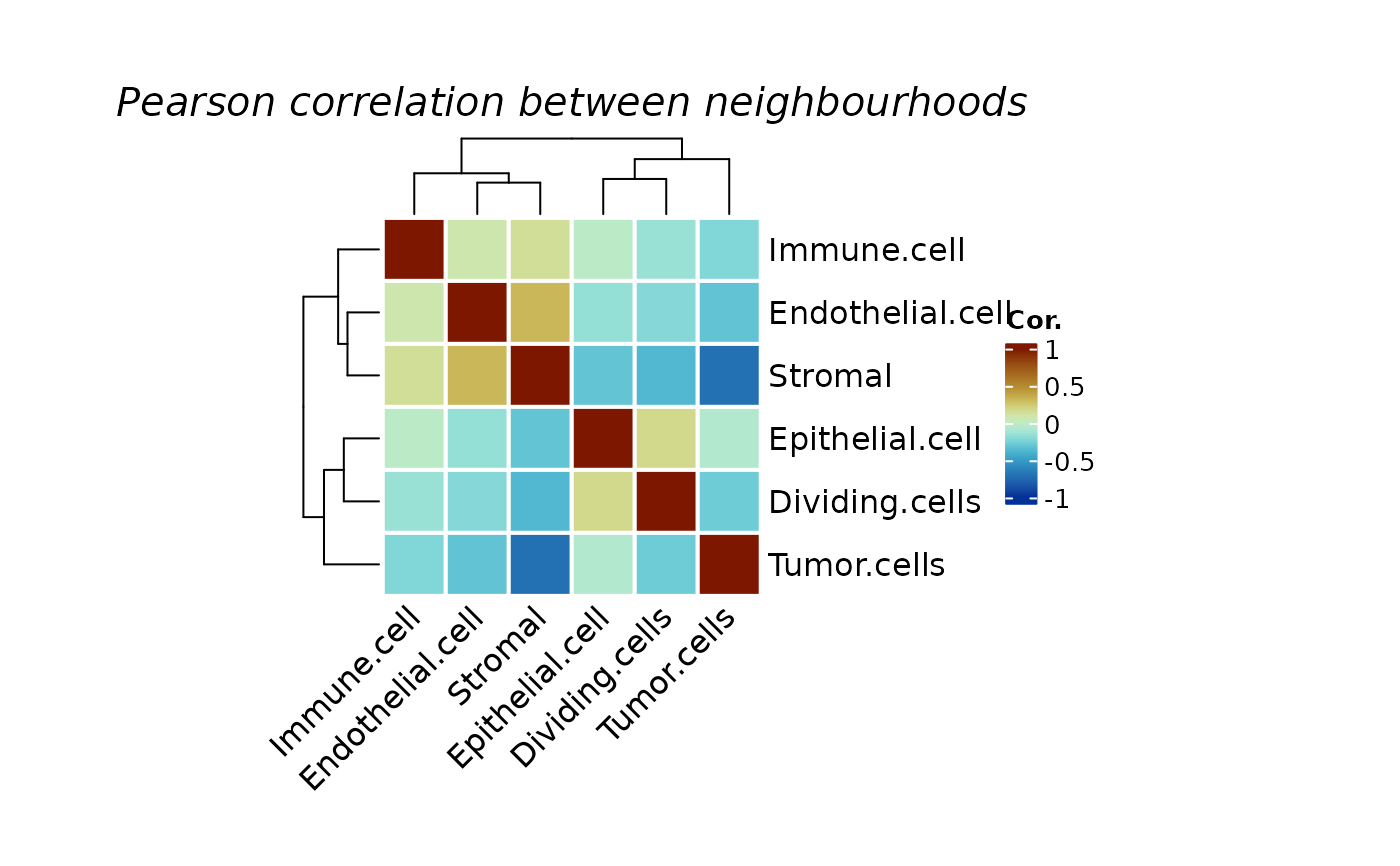
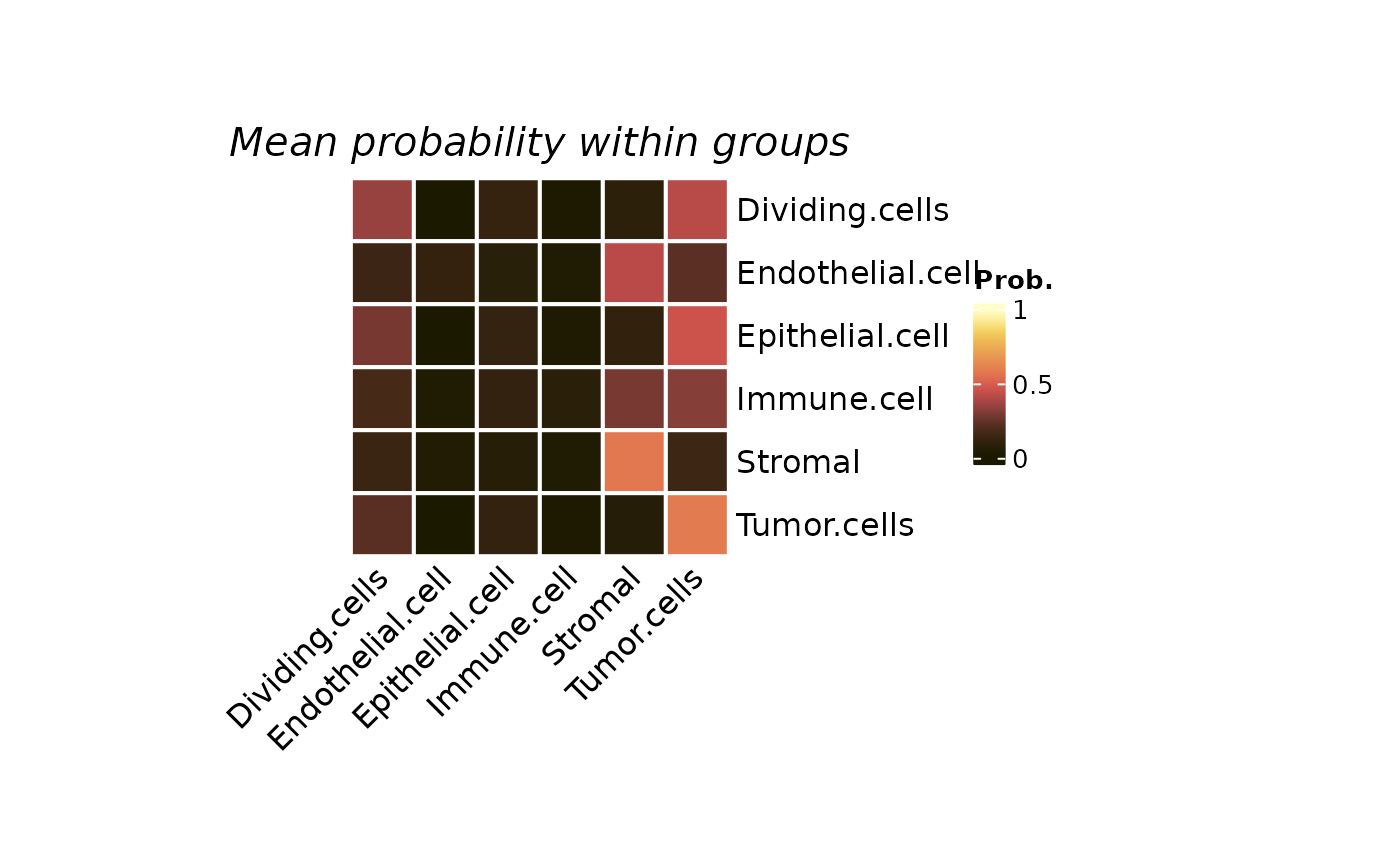
Plot heatmap for neighbourhood analysis
Usage
plotColocal(object, ...)

# S4 method for class 'matrix'
plotColocal(
  object,
  hm_width = 5,
  hm_height = 5,
  title = "Mean probability within groups"
)

# S4 method for class 'SpatialExperiment'
plotColocal(
  object,
  pm_cols,
  self_cor = TRUE,
  by_group = NULL,
  hm_width = 5,
  hm_height = 5,
  cluster_row = TRUE,
  cluster_col = TRUE,
  return_matrix = FALSE,
  title = "Mean probability within groups"
)
Arguments
- object
A probability matrix or SpatialExperiment.
- ...
Ignore parameter.
- hm_width
Integer. The width of heatmap.
- hm_height
Integer. The height of heatmap.
- title
Title for the heatmap.
- pm_cols
The colnames of probability matrix. This is requires for SpatialExperiment input. Assuming that the probability is stored in the colData.
- self_cor
Logical. By default is TRUE, inidicating running a correlation between neighbourhoods to perform a simple co-localization analysis. When this set to FALSE, it will plot the average probability of each neighbourhood by group using the by_group parameter.
- by_group
Character. This is required when self_cor is set to FALSE.
- cluster_row
Logical. Cluster rows.
- cluster_col
Logical. Cluster columns.
- return_matrix
Logical. Export a numeric matrix.
Examples
data("spe_test")

spe <- readHoodData(spe, anno_col = "celltypes")

fnc <- findNearCells(spe, k = 100)

pm <- scanHoods(fnc$distance)
#> Tau is set to: 22747.4

pm2 <- mergeByGroup(pm, fnc$cells)

spe <- mergeHoodSpe(spe, pm2)

plotColocal(spe, pm_cols = colnames(pm2))


plotColocal(spe, pm_cols = colnames(pm2), self_cor = FALSE, by_group = "cell_annotation")
