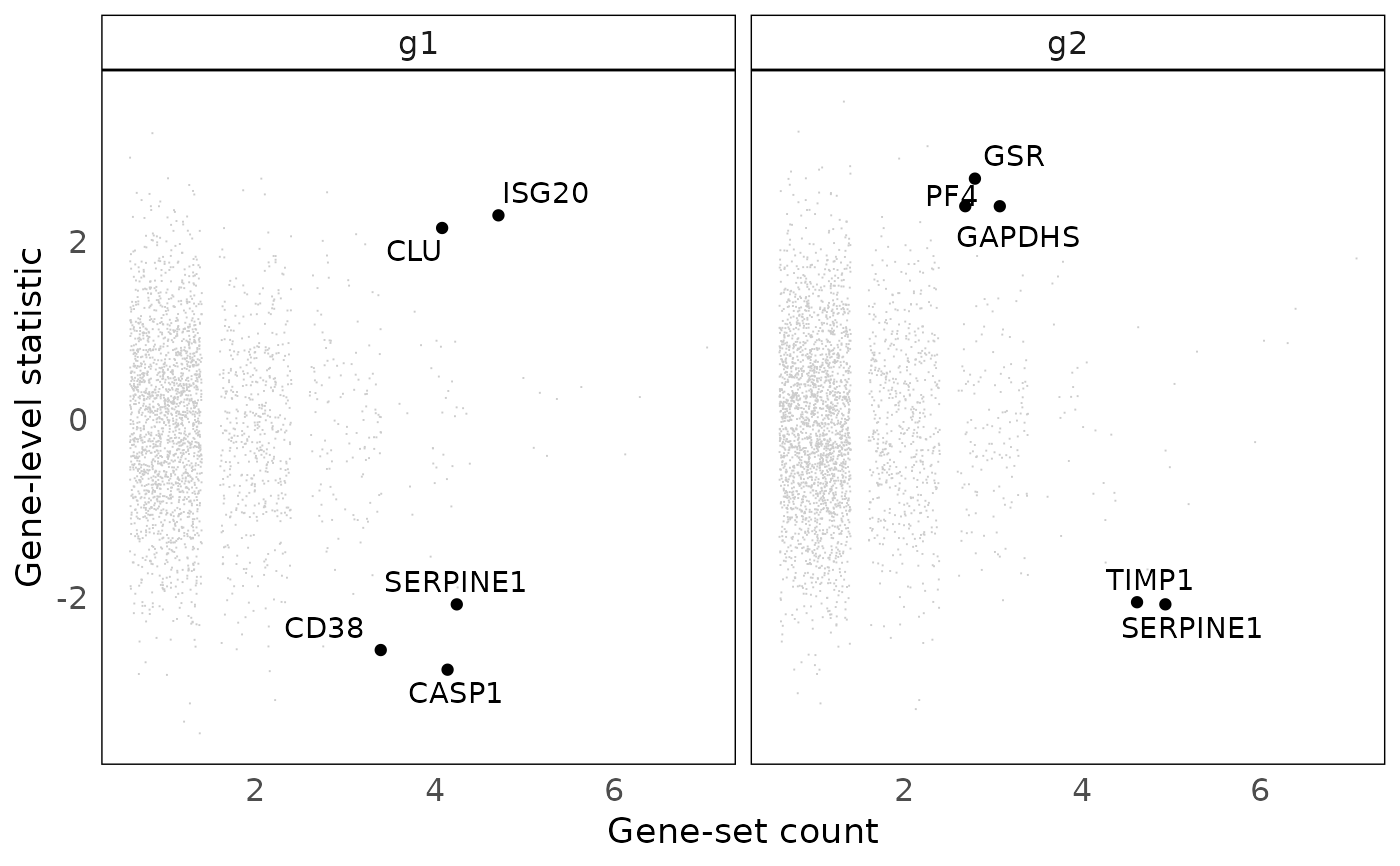
This function plots gene statistics against gene frequencies for any given cluster of gene sets. The plot can be used to identify genes that are over-represented in a cluster of gene-sets (identified based on gene-set overlaps) and have a strong statistic (e.g. log fold-chage or p-value).
plotGeneStats(
  geneStat,
  msigGsc,
  groups,
  statName = "Gene-level statistic",
  topN = 5
)
Arguments
- geneStat
a named numeric, containing the statistic to be displayed. The vector must be named with either gene Symbols or Entrez IDs depending on annotations in msigGsc.
- msigGsc
a GeneSetCollection object, containing gene sets from the MSigDB. The
GSEABase::getBroadSets()function can be used to parse XML files downloaded from MSigDB.- groups
a named list, of character vectors or numeric indices specifying node groupings. Each element of the list represent a group and contains a character vector with node names.
- statName
a character, specifying the name of the statistic.
- topN
a numeric, specifying the number of genes to label. The top genes are those with the largest count and statistic.
Value
a ggplot object, plotting the gene-level statistic against gene frequencies in the cluster of gene sets.