Compute and plot the results of a MDS analysis on gene expression data
Source:R/plotDR.R
plotMDS.RdCompute and plot the results of a MDS analysis on gene expression data
plotMDS(
  object,
  dims = c(1, 2),
  precomputed = NULL,
  textScale = 1,
  assay = 1,
  ...
)

# S4 method for DGEList
plotMDS(
  object,
  dims = c(1, 2),
  precomputed = NULL,
  textScale = 1,
  assay = 1,
  ...
)

# S4 method for ExpressionSet
plotMDS(
  object,
  dims = c(1, 2),
  precomputed = NULL,
  textScale = 1,
  assay = 1,
  ...
)

# S4 method for SummarizedExperiment
plotMDS(
  object,
  dims = c(1, 2),
  precomputed = NULL,
  textScale = 1,
  assay = 1,
  ...
)

# S4 method for SingleCellExperiment
plotMDS(
  object,
  dims = c(1, 2),
  precomputed = NULL,
  textScale = 1,
  assay = 1,
  ...
)

# S4 method for SpatialExperiment
plotMDS(
  object,
  dims = c(1, 2),
  precomputed = NULL,
  textScale = 1,
  assay = 1,
  ...
)
Arguments
- object
a DGEList, SummarizedExperiment or ExpressionSet object containing gene expression data.
- dims
a numeric, containing 2 values specifying the dimensions to plot.
- precomputed
a dimensional reduction results from either
limma::plotMDS.- textScale
a numeric, specifying the relative scale factor to apply to text on the plot.
- assay
a numeric or character, specifying the assay to use (for
SummarizedExperimentand its derivative classes).- ...
aesthetic mappings to pass to
ggplot2::aes_string().
Value
a ggplot2 object
Examples
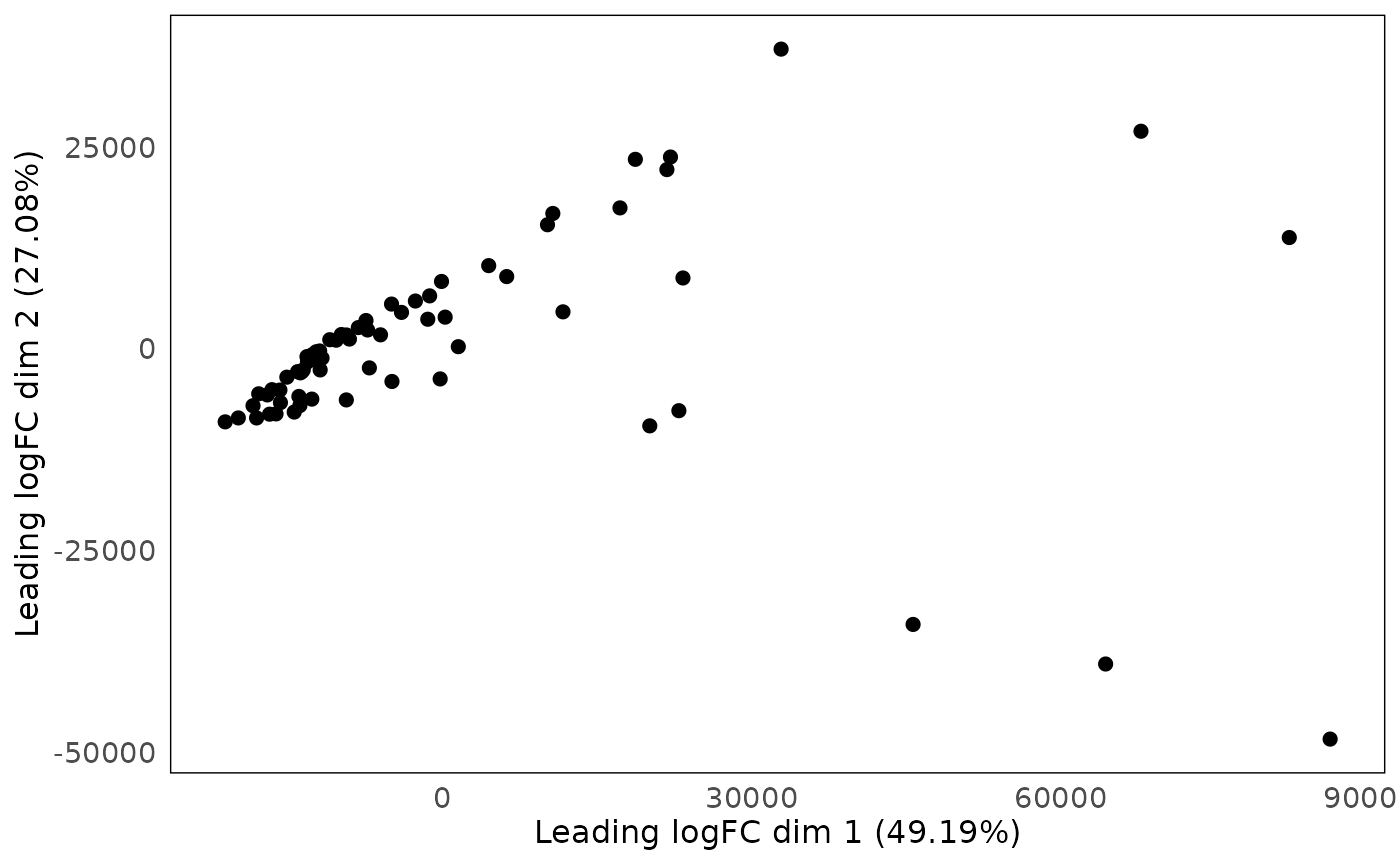
data("dkd_spe_subset")
standR::plotMDS(dkd_spe_subset)