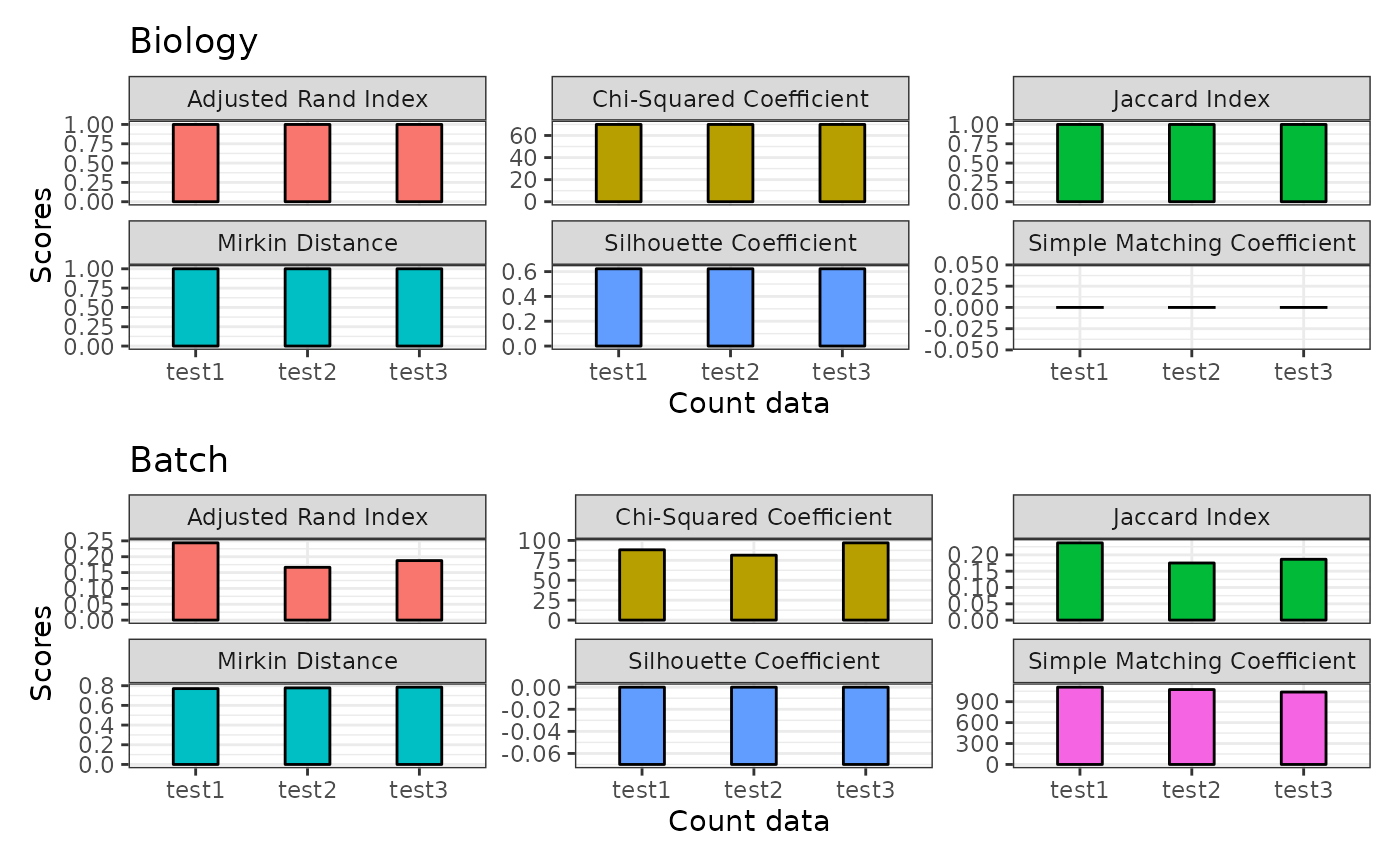
Compare and evaluate different batch corrected data with plotting.
Source:R/sumBatchCorEval.R
plotClusterEvalStats.RdCompare and evaluate different batch corrected data with plotting.
plotClusterEvalStats(
  spe_list,
  bio_feature_name,
  batch_feature_name,
  data_names,
  colors = NA
)
Arguments
- spe_list
A list of Spatial Experiment object.
- bio_feature_name
The common biological variation name.
- batch_feature_name
The common batch variation name.
- data_names
Data names.
- colors
Color values of filing the bars.
Value
A ggplot object.