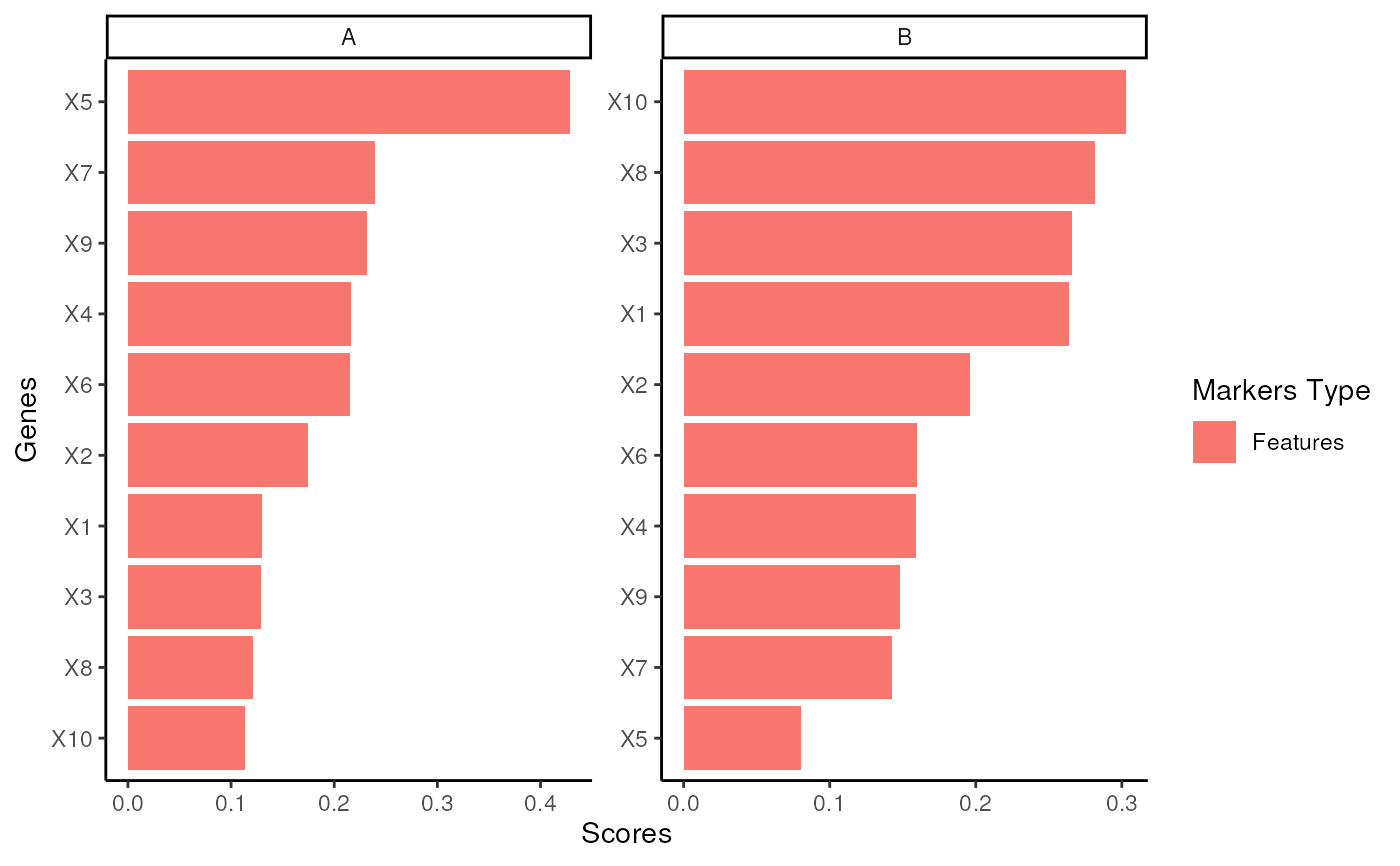
barplot of processed score
score_barplot(top_markers, column = ".dot", f_list, n = 30)Arguments
- top_markers
output of
top_markers()- column
character, specify which column used as group label
- f_list
a named list of markers
- n
numeric, number of returned top genes for each group
Value
ggplot object