This function takes a single-column data frame, which is a
single-column subset of the ranked matrix data generated using
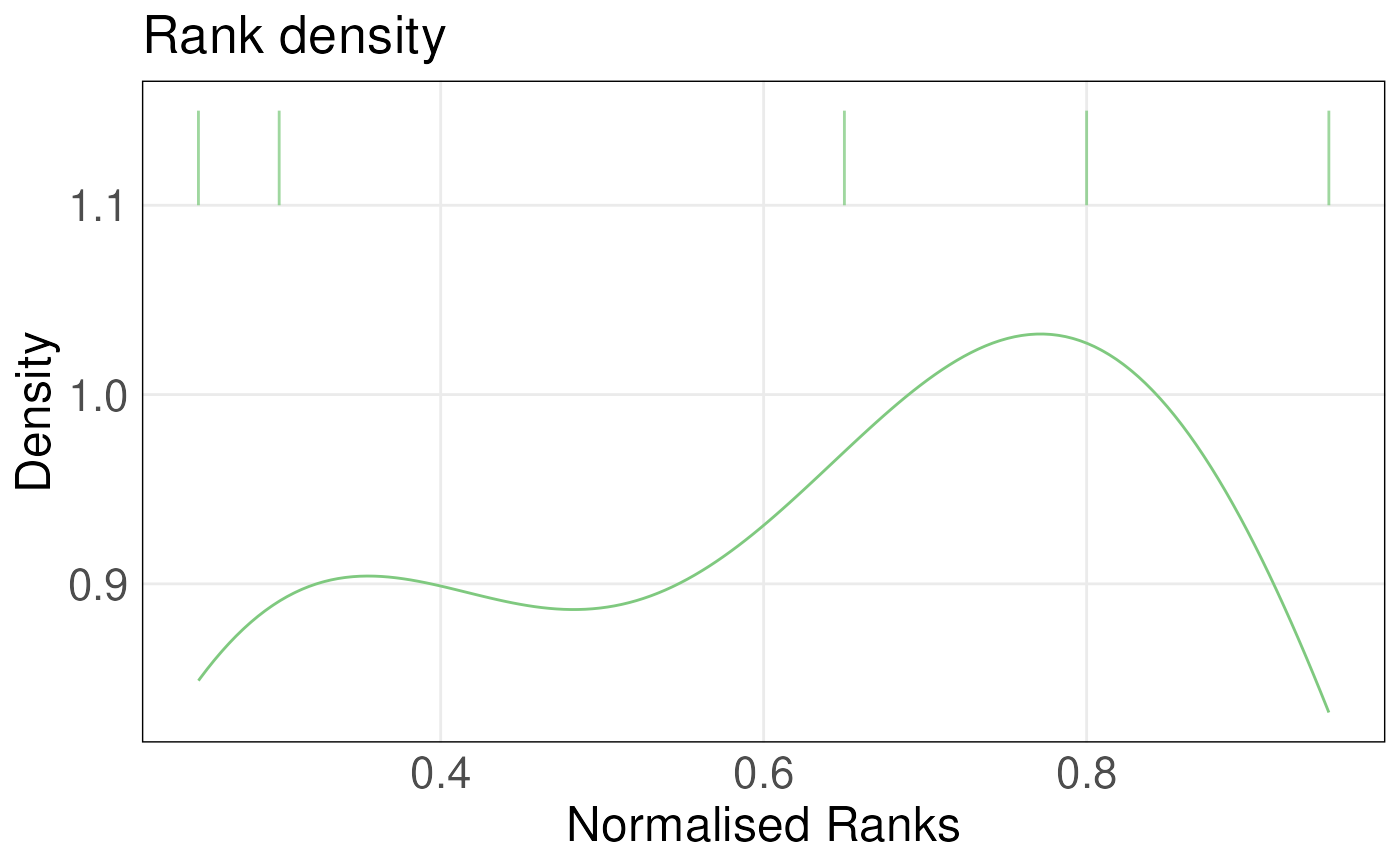
rankGenes() function, and the gene sets of interest as inputs. It plots
the density of ranks for genes in the gene set and overlays a barcode plot
of these ranks. Ranks are normalized by dividing them by the maximum rank.
Densities are estimated using KDE.
plotRankDensity(
  rankData,
  upSet,
  downSet = NULL,
  isInteractive = FALSE,
  textSize = 1.5
)

# S4 method for class 'ANY,vector,missing'
plotRankDensity(
  rankData,
  upSet,
  downSet = NULL,
  isInteractive = FALSE,
  textSize = 1.5
)

# S4 method for class 'ANY,GeneSet,missing'
plotRankDensity(
  rankData,
  upSet,
  downSet = NULL,
  isInteractive = FALSE,
  textSize = 1.5
)

# S4 method for class 'ANY,vector,vector'
plotRankDensity(
  rankData,
  upSet,
  downSet = NULL,
  isInteractive = FALSE,
  textSize = 1.5
)

# S4 method for class 'ANY,GeneSet,GeneSet'
plotRankDensity(
  rankData,
  upSet,
  downSet = NULL,
  isInteractive = FALSE,
  textSize = 1.5
)
Arguments
- rankData
one column of the ranked gene expression matrix obtained from the
rankGenes()function, usedrop = FALSEwhen subsetting the ranked gene expression matrix, see examples.- upSet
GeneSet object or a vector of gene Ids, up-regulated gene set
- downSet
GeneSet object or a vector of gene Ids, down-regulated gene set
- isInteractive
Boolean, determine whether the returned plot is interactive
- textSize
numberic, set the size of text on the plot
Value
A ggplot object (or a plotly object) with a rank density plot overlayed with a barcode plot
Examples
ranked <- rankGenes(toy_expr_se)
plotRankDensity(ranked[,2,drop = FALSE], upSet = toy_gs_up)