Plot source and true differential networks from simulations
Source:R/simulation_plot.R
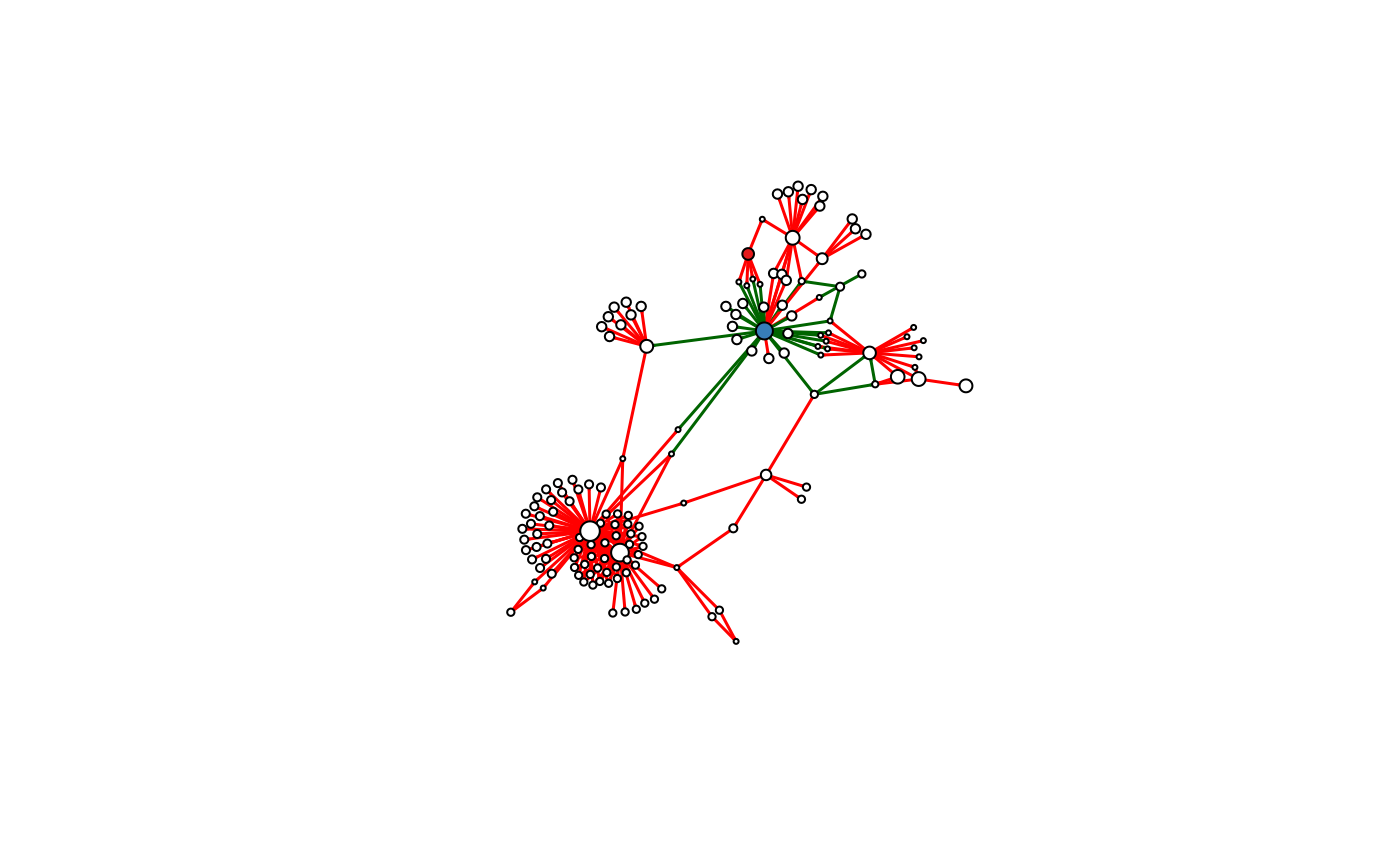
plotSimNetwork.RdPlots either the source network or the true differential network for all KDs performed in the simulation. KD nodes are coloured with their resulting differential networks coloured accordingly.
plotSimNetwork(
  simulation,
  what = c("source", "direct", "influence", "association"),
  ...
)
Arguments
- simulation
a list, storing data and results generated from simulations
- what
a character, indicating which network to retrieve, 'source' (default), 'direct', 'influence' or 'association'
- ...
additional parameters to
plot.igraph
Value
a plot of the network
Details
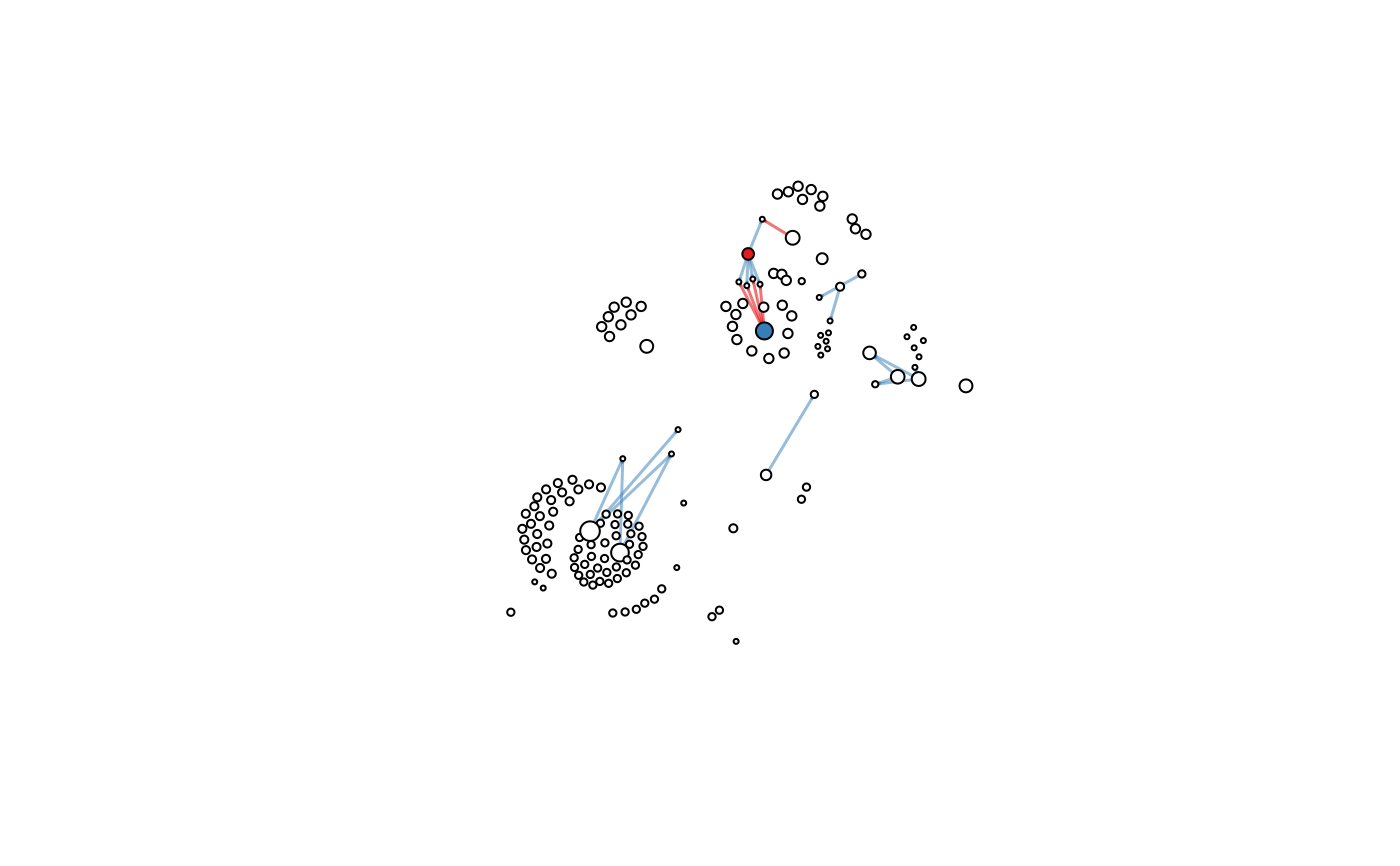
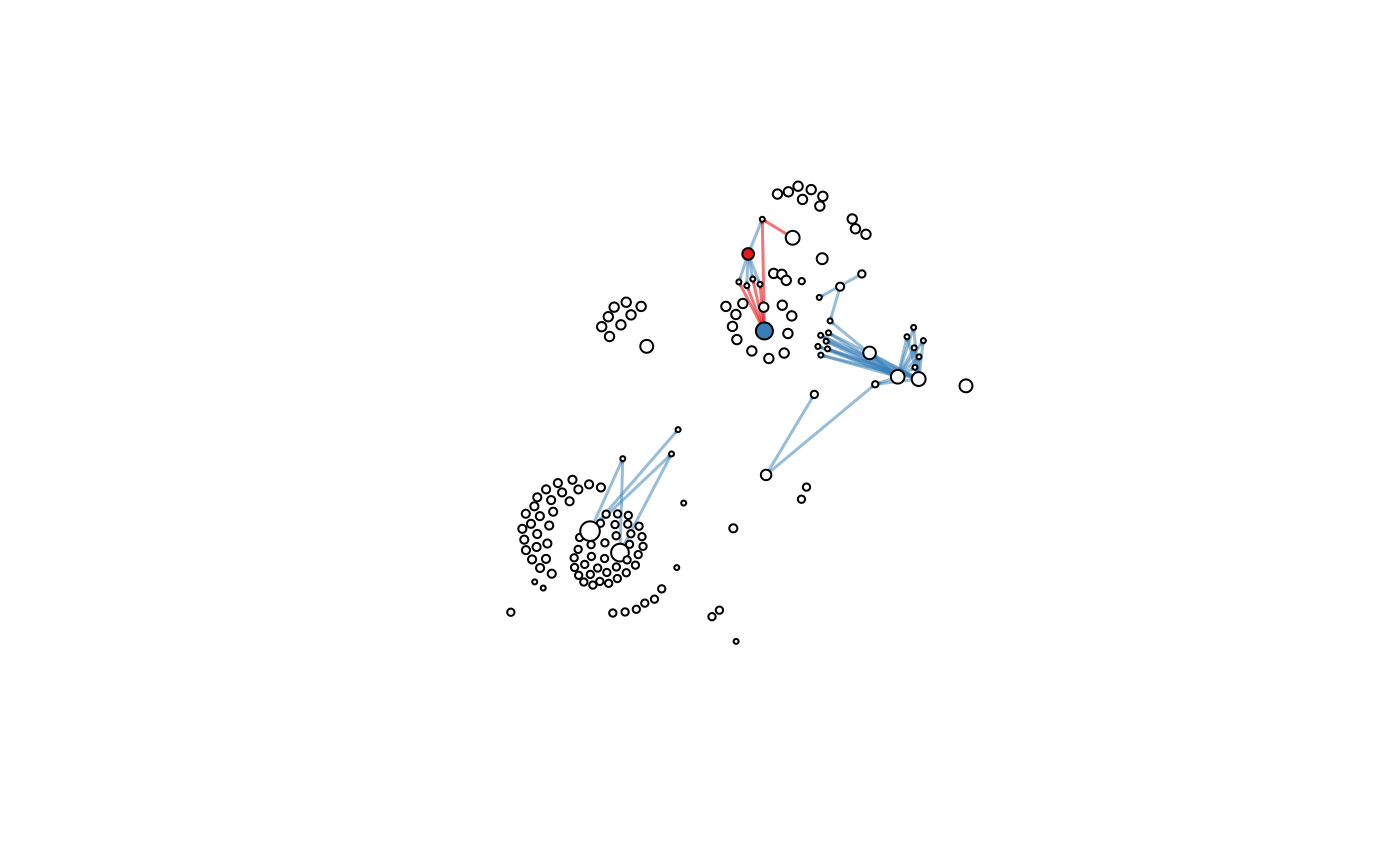
The direct, influence and association networks represent different levels of true differential networks. The direct network contains differential regulatory interactions present in the original network. The influence network includes upstream interactions and the association network includes non-causative differential interactions.
See also
Examples
data(sim102)
plotSimNetwork(sim102)

plotSimNetwork(sim102, what = 'direct')

plotSimNetwork(sim102, what = 'influence')

plotSimNetwork(sim102, what = 'association')